

Photo by Алекс Арцибашев on Unsplash
6 ways statistics fool smart people
by Miles Corran · November 19, 2026
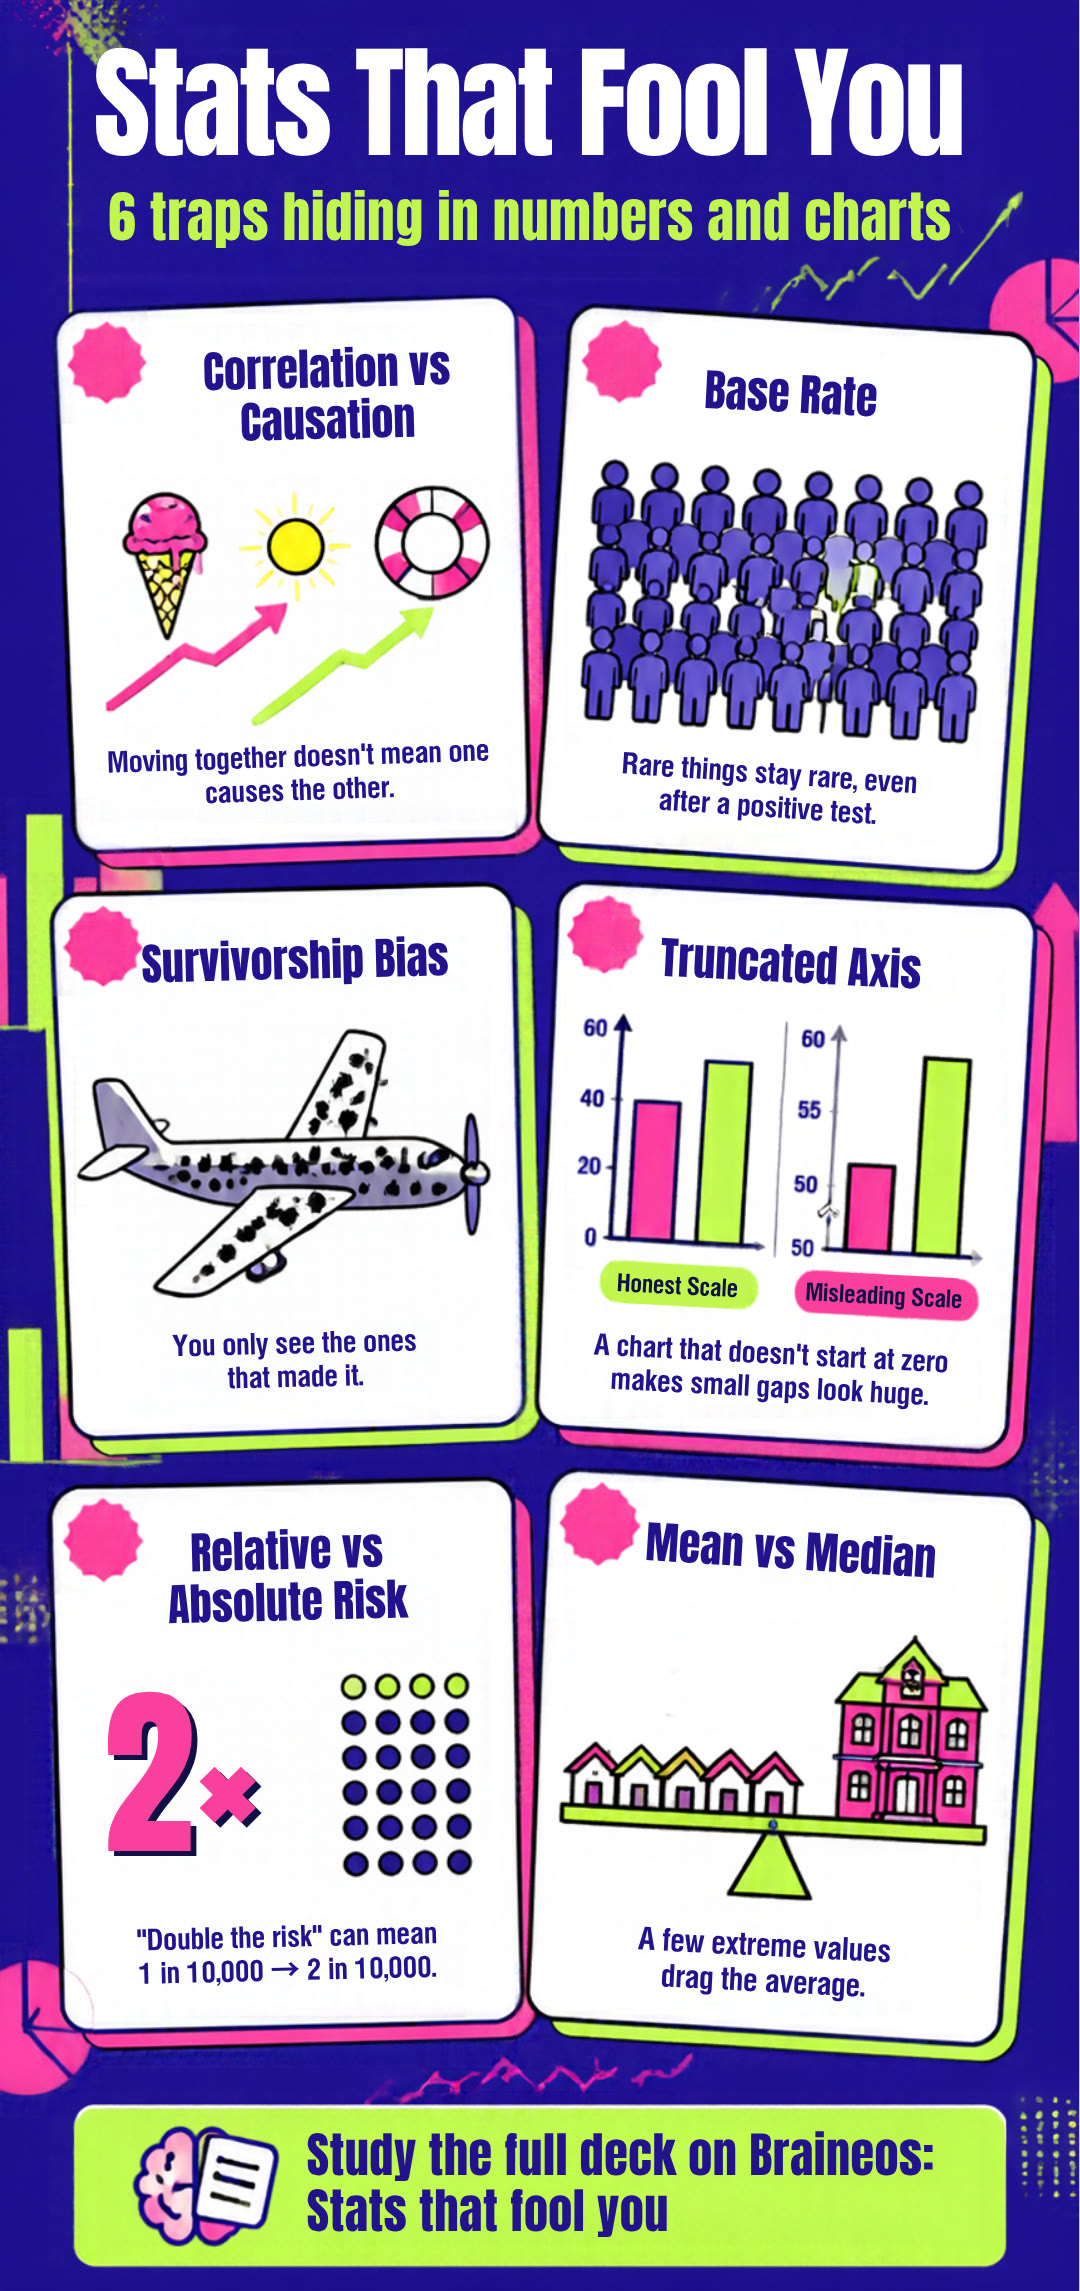
Numbers feel objective, which is exactly why a misleading one is so convincing. These six traps turn up in headlines, ads and charts every week. Each one comes from our free deck Stats that fool you, which has 16 cards to practise spotting them.
Correlation vs causation
Two things moving together doesn't show that one causes the other. Ice cream sales and drownings both rise in summer, but the link is a third thing: hot weather. Ask: what else could be driving both?
Base rate
How common something is to begin with. Ignore it and rare-event results look more certain than they are: even a very accurate test for a very rare condition produces many false alarms. Ask: how common was this before the test?
Survivorship bias
Drawing conclusions only from the cases that made it through, while the failures are out of sight. "Famous founders dropped out of college" says nothing about the many dropouts you never hear of. Ask: who's missing from this picture?
Truncated axis
A chart whose scale doesn't start at zero makes small differences look big. Ask: where does the axis start?
Relative vs absolute risk
"Doubles the risk" can mean going from 1 in 10,000 to 2 in 10,000 (the deck's own example). Doubled, but still tiny. Ask: doubled from what?
Mean vs median
A few extreme values pull the mean. The median is the middle value and isn't pulled. When an average income sits far above the median, a few very high incomes are doing the pulling. Ask: is this the mean or the median?
The deck has these six and ten more, including cherry-picking, regression to the mean and selection bias. Study Stats that fool you free on Braineos, or play it as a Tower Defense game.